
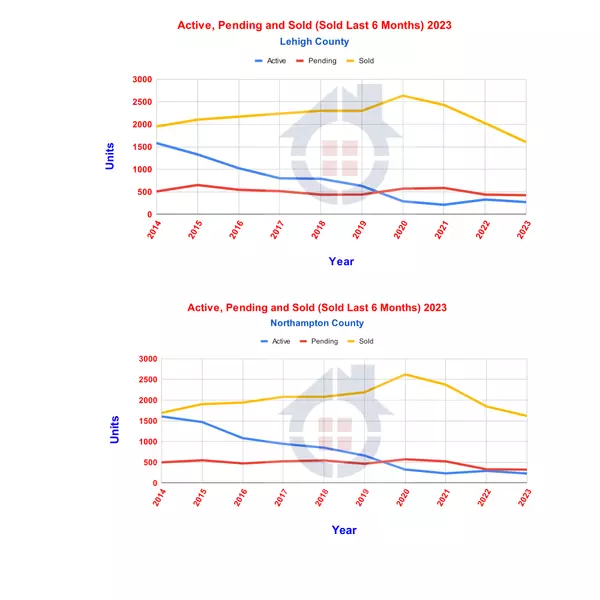
These charts display the active, pending, and sold units as of the end of the 4th quarter for each year. The units sold are for the last six months of the quarter. Displaying the last six months relates to how the Absorption Rate is computed.
The Lehigh Valley has a relatively healthy real estate market. Yes, we still lack inventory relative to the same period in 2014 and the same period in 2022; however, the closed sales are tracking very well compared to active inventory for the 4th quarter.
Active inventory (blue line in charts) in the 4th quarter of 2014 in Lehigh and Northampton Counties was 3,187 units compared to the 4th quarter of 2023 units of 501. That is a drop of 84.3%. Pending units (red line in charts) at the end of the 4th quarter of 2014 were 1,007, and pending units at the end of the 4th quarter of 2023 were 746. Our pending units have dropped by 25.9%. Sold units (yellow line in charts) for the last six months of the 3rd quarter in 2014 was 3,643 compared to 2023 sold units of 3,221, which is a drop of only 11.6%.
Active units in the 4th quarter of 2022 in Lehigh and Northampton Counties was 619 units compared to the 4th quarter of 2023 units of 501. That is a drop of 19% year over year. Pending units at the end of the 4th quarter of 2022 were 768 compared to pending units for the same period 2023, of 746 units. Our pending units have dropped by 2.8%. Sold units for the last six months of the 4th quarter of 2022 was 3,871 compared to 2023 sold units of 3,221, which is a drop of 16.8%.
Further in this report, I will discuss the Pending Ratio. The pending ratio indicates the supply and demand of the market.
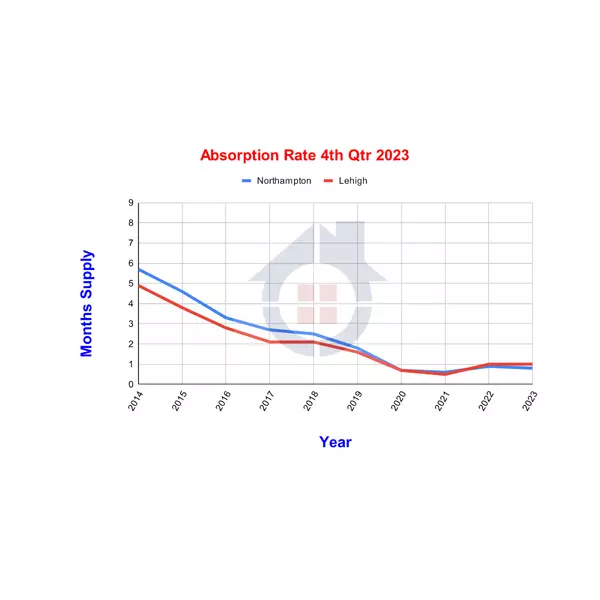
The absorption rate estimates how fast listings are currently selling measured in months. For example, if 100 properties sell per month and there are 800 properties for sale - there is an 8-month supply of inventory before counting the additional properties that come on the market.
In Northampton County, the absorption rate at the end of the 4th quarter of 2021 was .6 months, 2022 was .9 months, and 2023 was .8 months' supply. For perspective, in 2014, the absorption rate was 5.7 months supply. 5.7 months' supply is considered a neutral market (not buyer’s or seller’s market), and .8 months' supply is considered an extreme seller’s market.
In Lehigh County, the absorption rate at the end of the 4th quarter of 2021 was .5 months, 2022 was 1 month, and 2023 was 1 month. For perspective, in 2014, the absorption rate was 4.9 months' supply. A supply of 4.9 months is considered a seller’s market.
Contrary to many pundits' predictions, the overall Lehigh Valley real estate market is still a very strong sellers market. Yes, some price ranges and market areas are not strong sellers' markets. I will generate market trend reports for subsets of the Lehigh Valley market soon.
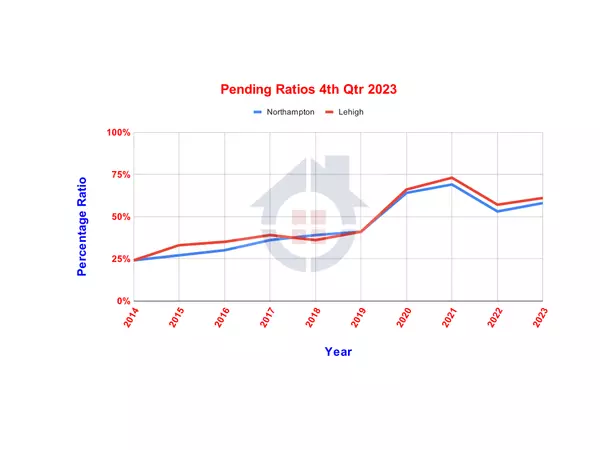
The Pending Ratio indicates the supply and demand of the market. Specifically, a high ratio means that listings are in demand and quickly going to contract. Alternatively, a low ratio means insufficient qualified buyers for the existing supply.
Northampton County, at the end of the 4th quarter of 2023, the pending ratio was 58%. For perspective, in 2014, the pending ratio was 24%. For the 4th quarter, 2021 had the highest pending ratio for Northampton County, which was 69%. The pending ratio dropped to 53% in 2022 and climbed to 68% in 2023.
Lehigh County, at the end of the 34th quarter of 2023, the pending ratio was 61%. Again, for perspective, in 2014, the pending ratio was 24%. For the 4th quarter of 2021, the highest ratio is 73%. The ratio dropped to 57% in 2022 and climbed to 61% in 2023.
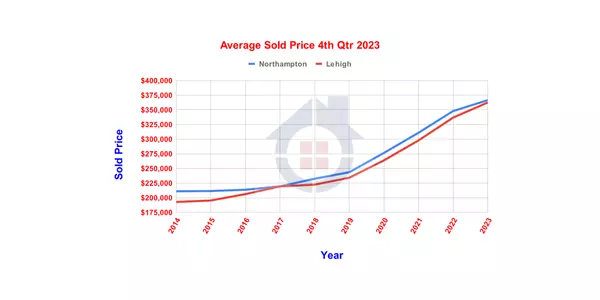
Sold Price Trend
The average sold prices in Northampton and Lehigh Counties have continued to increase from 2014 to 2023, with the sharp increases starting in 2019.
Northampton County prices increased 73.6% between 2014 and 2023 as of the 4th quarter of each respective year. The 4th quarter of 2023 has shown a 5.3% increase in sold prices over the same period for 2022. The increase is lower than the increase between 2021 and 2022, which was 11.93%.
Lehigh County prices increased 88% between 2014 and 2023 as of the 4th quarter of each respective year. The 4th quarter of 2023 has shown a 7.6% increase in sold prices. The increase is lower than the increase between 2021 and 2022, which was a 13% increase.
In light of the increase in interest rates we have experienced in 2023, we still have a robust real estate market.
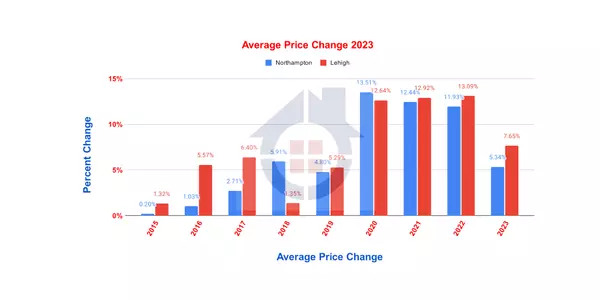
Here is an interesting chart displaying the average price increases for Northampton and Lehigh Counties from 2015 to 2023. My starting point is 2015 because we only started recording all the statistics in 2014, therefore, I do not have a benchmark from 2013 to compute the increase in 2014.
The sharpest increases in the Lehigh Valley real estate market were in 2020, 2021, and 2022, with double-digit yearly gains. In 2023, the gains returned to a more average increase in value. The most important trend here is that we have yet to experience a decrease in values that many have predicted or have occurred in other markets in the country.
With increased interest rates, we still have high demand, as shown by the increase in the pending ratio.
Now is the time to buy your first house or change your housing, either moving up or downsizing.
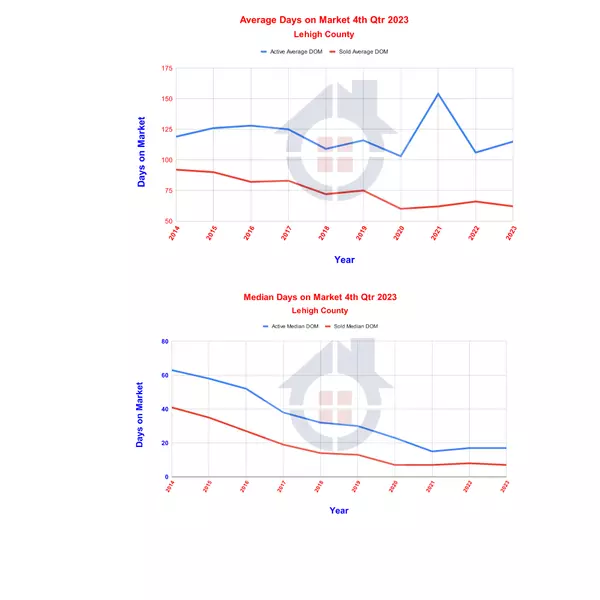
Days on Market Lehigh County
The debate will rage between what is more accurate, Average or Median. I have decided to show both in the charts for Days on Market.
There are so many factors that affect Days on Market, such as (1) Pricing, was the property on the market longer because it was overpriced; (2) Condition, did the property linger on the market due to poor condition as well as not priced for condition; and (3) New Construction, often builders will put a model home on the market or put a new construction on the market that has not been completed. In those instances, the property will have a longer than average market time.
In the case of the 4th quarter of 2023 Lehigh County market time, you will see how 2021 has a spike in the Active Average Days on Market. Compared to the Active Median Days on Market, you have a smooth trend line from the 2014 63 days to the 2023 17 days. You also have a smooth trend line for Sold Average Days on Market and the Sold Median Days on Market.
Pricing a property correctly, preparing the property for the market, and executing an excellent marketing program will decrease the market time. These factors will also increase the return to the property owner.
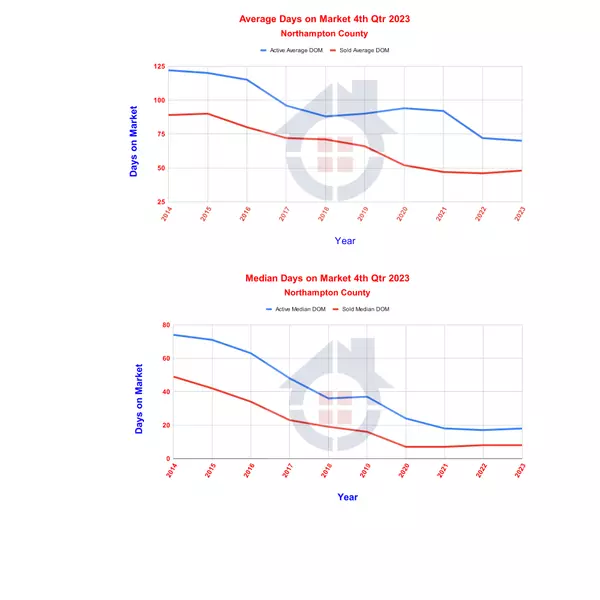
Days on Market Northampton County
Many of the comments for Lehigh County will also apply to Northampton County.
The debate will rage between what is more accurate, Average or Median. I have decided to show both in the charts for Days on Market.
There are so many factors that affect Days on Market, such as (1) Pricing, was the property on the market longer because it was overpriced; (2) Condition, did the property linger on the market due to poor condition as well as not priced for condition; and (3) New Construction, often builders will put a model home on the market or put a new construction on the market that has not been completed. In those instances, the property will have a longer than average market time.
In the case of the 4th quarter of 2023 Northampton County market time, we do not have a spike in the Active Average Days on Market. In the Average and Median, we have a smooth descent from the high in 2014 to the low in 2023.
The Median Active Days on Market for Northampton County was a a high of 74 days in 2014 to a low of 18 days in 2023. The Median Sold Days on Market for Northampton County was a high of 49 days in 2014 to a low of 8 days in 2023.
Pricing a property correctly, preparing the property for the market, and executing an excellent marketing program will decrease the market time. These factors will also increase the return to the property owner.